Kp-index
Kp-index forecast
| Min. | Max. | |
|---|---|---|
| Friday | Kp2 | Kp4- |
| Saturday | Kp1+ | Kp2- |
| Sunday | Kp1+ | Kp2- |
Real Time Solar Wind
With the current speed, it will take the solar wind 60 minutes to propagate from DSCOVR to Earth.

Latest news
Tuesday, 5 August 2025
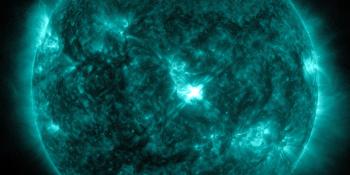
M4.4 solar flare from sunspot region 4168
Monday, 2 June 2025
The CME did not disappoint! More storming activity to come?
Saturday, 31 May 2025
M8.2 solar flare, Strong G4 geomagnetic storm watch
Latest forum messages
large-scale structure of coronal holes since Dec 2024 15Incoming & Unnumbered Active Regions 1997Perseids 2025 43Growth of Cycle 25 923Filaments and prominences 263
More topicsSupport SpaceWeatherLive.com!
A lot of people come to SpaceWeatherLive to follow the Solar activity or if there is a chance to see the aurora, but with more traffic comes higher costs to keep the servers online. If you like SpaceWeatherLive and want to support the project you can choose a subscription for an ad-free site or consider a donation. With your help we can keep SpaceWeatherLive online!


Space weather facts
| Last X-flare | 2025/06/19 | X1.9 |
| Last M-flare | 2025/08/12 | M1.8 |
| Last geomagnetic storm | 2025/08/09 | Kp6 (G2) |
| Spotless days | |
|---|---|
| Last spotless day | 2022/06/08 |
| Monthly mean Sunspot Number | |
|---|---|
| July 2025 | 125.6 +9.3 |
| August 2025 | 142.4 +16.8 |
| Last 30 days | 138.7 +31.9 |