L'indice Kp
Prévisions de l'indice Kp
| Min. | Max. | |
|---|---|---|
| vendredi | Kp2+ | Kp6- |
| samedi | Kp3+ | Kp6 |
| dimanche | Kp2 | Kp4- |
Vent solaire en temps réel
A la vitesse actuelle, le vent solaire prendra 60 minutes pour se propager de ACE à la Terre.
Vent solaire
Vitesse: km/sec
Densité: p/cm3
Champ Magnétique Interplanétaire
Bt: nT
Bz: nT
Info Plus de données
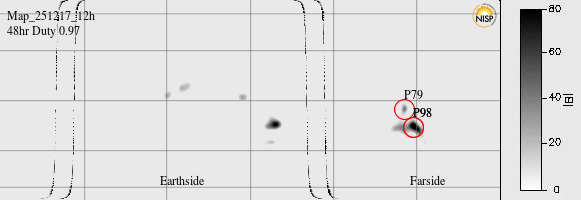
Magnétomètres

Perturbation Tempête Temps Index
Phase de la Lune
Lune gibbeuse décroissante
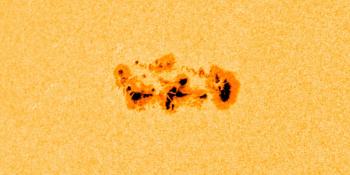
Régions de taches de soleil
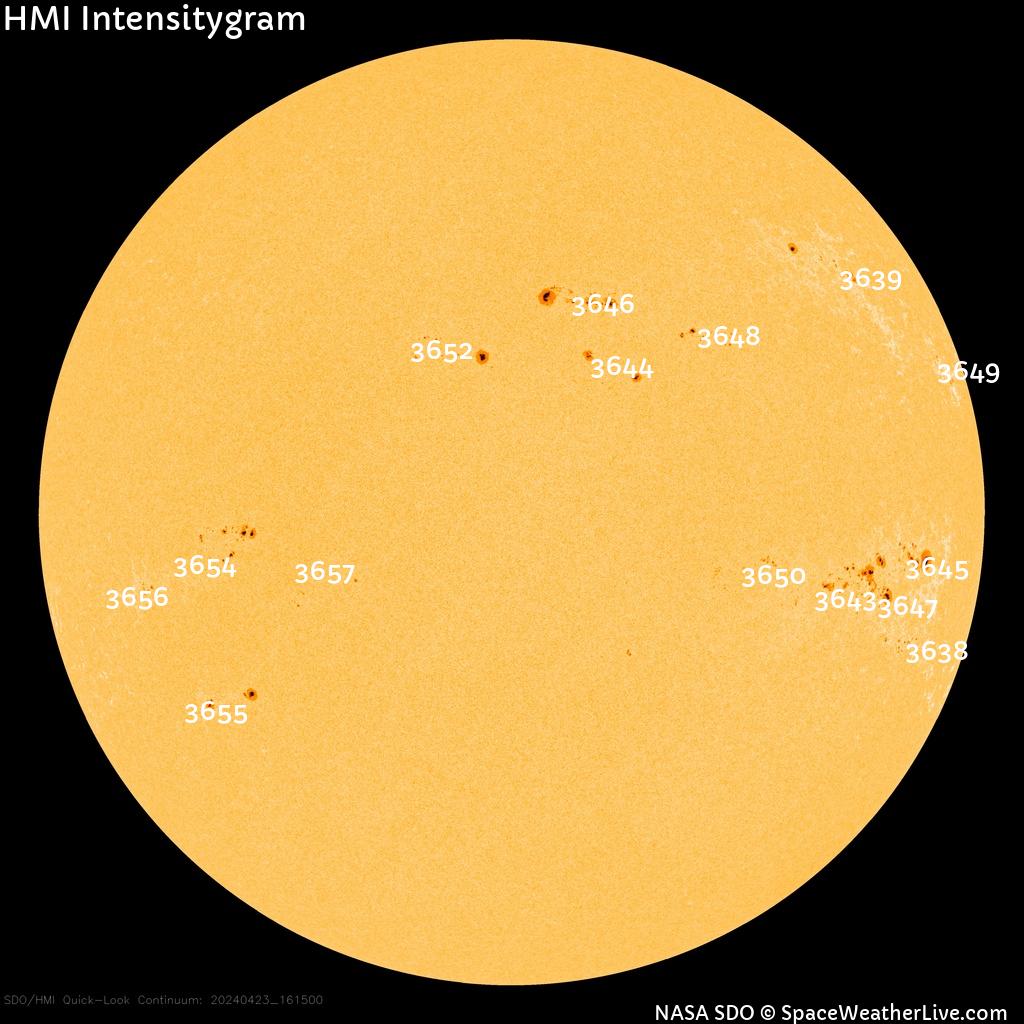
Régions de taches de soleil
| Région | Nombre de taches solaires | Classe Magn. | Classe Tache |
|---|---|---|---|
| 4399 | 1 | HSX | |
| 4403 | 2 | CSO | |
| 4404 | 3 | CSO | |
| 4405 | 15 | EAO | |
| 4406 | 1 | HSX | |
| 4408 | 1 | HSX | |
| 4409 | 15 | DAI | |
| 4410 | 5 | CSO |
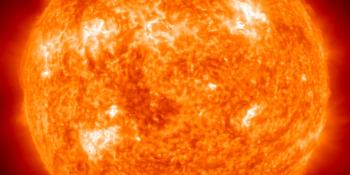
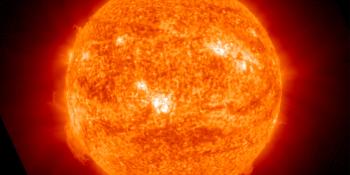
Le soleil d'aujourd'hui
| Nombre de taches solaires | 152 | 22 |
| Nouvelle régions | 1 | 1 |
| Flux Solaire Radio de 10.7cm | 140 | -2 |
| Rotation de Carrington | 2309 | |
Éruptions solaires
Activité solaire des deux dernières heures
Valeur actuelle
Valeur maximum (2h max)
Valeur maximum (24h max)
Probabilité d'éruption
| Éruptions solaires classe-C | 99% |
| Éruptions solaires classe-M | 55% |
| Éruptions solaires classe-X | 15% |
Dernières nouvelles
lundi, 30 mars 2026
X1.5 solar flare
mardi, 17 mars 2026
M2.7 solar flare, CME arrival possible
dimanche, 1 février 2026
Complex sunspot region 4366
Forum
Late 2026/04/01 Filament CME 61Space Weather Memes 810AR4409 114AR4403 39GoPro tips -which model, what settings etc 7
Plus de messages du forumAidez SpaceWeatherLive.com !
De nombreuses personnes consultent SpaceWeatherLive pour suivre l'activité solaire ou observer les aurores boréales, mais l'augmentation du trafic engendre des coûts plus élevés pour maintenir les serveurs en ligne. Si vous appréciez SpaceWeatherLive et souhaitez soutenir le projet, vous pouvez vous abonner pour un site sans publicité ou faire un don. Grâce à votre aide, SpaceWeatherLive restera accessible !


La Météo Spatiale en faits
| Dernière classe X | 30/03/2026 | X1.5 |
| Dernière classe M | 03/04/2026 | M1.3 |
| Dernier orage géomagnétique | 02/04/2026 | Kp6- (G2) |
| Jours sans taches solaires | |
|---|---|
| 365 derniers jours | 3 jours |
| 2026 | 3 jours (3%) |
| Dernier jour sans taches solaires | 24/02/2026 |
| Nombre mensuel moyen de taches solaires | |
|---|---|
| mars 2026 | 85.9 +7.7 |
| avril 2026 | 141 +55.1 |
| 30 derniers jours | 94.6 +27 |
A ce jour dans l'histoire*
Aurora on this day in history
No observations submitted for this day in history. If you've observed the aurora and you have some amazing photos to show off, submit your observations now!
Submit your aurora observation