Sommario dell'attività solare e geofisica
Sotto troverete un rapporto giornaliero della NOAA sull'attività solare e geofisica durante l'ultima giornata e la previsione per i giorni a venire. Questa pagina è aggiornata quotidianamente verso mezzanotte.
Sommario dell'Attività Solare e Geofisica 2026 May 20 0245 UTCPreparati dal SWPC della NOAA© ed elaborati da SpaceWeatherLive.com
Sommario Congiunto USAF/NOAA dell'Attività Solare e Geofisica
SGAS Numero 140 Emesso alle 0245Z il May 20 2026 Questo rapporto è compilato dai dati ricevuti a SWO il 19 MayA. Eventi Energetici
Inizio  Max  Fine  Rgn   Loc   Xray  Op 245MHz 10cm   Sweep
Nessuna
B. Eventi Protonici
Nessuna.
C. Sommario dell'Attività Geomagnetica
The geomagnetic field was at quiet
to active levels.
D. Riscaldamento Stratosferico
Non disponibile
E. Indici Giornalieri: (valori preliminari/stimati in tempo reale)
10 cm 106  SSN 072  Afr/Ap 018/019   X-ray Background B3.3
Fluenza Protonica Giornaliera (accumulo di flusso in 24 ore)
GT 1 MeV 2.0e+06   GT 10 MeV 1.8e+04 p/(cm2-ster-day)
(Orbita sincrona di W72 gradi del satellite GOES-19)
Fluenza di Elettroni Giornaliera
GT 2 MeV 1.20e+08 e/(cm2-ster-day)
(Orbita sincrona di W72 gradi del satellite GOES-19)
Indice K di 3 ore
Boulder 2 4 4 4 3 4 2 2 Planetario 2 3 4 4 4 4 3 3
F. Commenti
Nessuna
Ultime notizie
mercoledì, 13 maggio AM
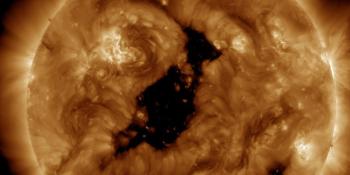
Coronal hole faces Earth
lunedì, 30 marzo PM
X1.5 solar flare
martedì, 17 marzo PM
M2.7 solar flare, CME arrival possible
Ultimi messaggi dal forum
Current Farside Activity 571Space Weather Memes 832Unspecified geomagnetic activity 258Incoming & Unnumbered Active Regions 390Coronal Hole 53 101
Altri argomentiSupporta SpaceWeatherLive.com!
A lot of people come to SpaceWeatherLive to follow the Solar activity or if there is a chance to see the aurora, but with more traffic comes higher costs to keep the servers online. If you like SpaceWeatherLive and want to support the project you can choose a subscription for an ad-free site or consider a donation. With your help we can keep SpaceWeatherLive online!


Notizie sul meteo spaziale
| Ultimo brillamento X | 2026/04/24 | X2.5 |
| Ultimo brillamento M | 2026/05/17 | M1.4 |
| Ultima tempesta geomagnetica | 2026/05/16 | Kp6- (G2) |
| Giorni senza macchie | |
|---|---|
| Ultimi 365 giorni | 3 giorni |
| 2026 | 3 giorni (2%) |
| Ultimo giorno senza macchie | 2026/02/24 |
| Media mensile Numero di Macchie Solari | |
|---|---|
| aprile 2026 | 79.3 -6.6 |
| maggio 2026 | 89.2 +9.9 |
| Ultimi 30 giorni | 99.3 +7.6 |
Questo giorno nella storia*
Aurora on this day in history
No observations submitted for this day in history. If you've observed the aurora and you have some amazing photos to show off, submit your observations now!
Submit your aurora observation