Viewing archive of Monday, 29 January 2024
Solar flares
The archive is not available for this date.
All times in UTC
Latest news
Sunday, 1 February 2026
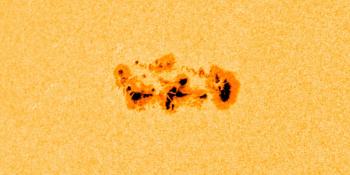
Complex sunspot region 4366

Monday, 19 January 2026
CME impact! S4 solar radiation storm
Sunday, 18 January 2026
X1.9 solar flare with earth-directed CME
Latest forum messages
AR4366 704Space Weather Memes 784Do the high-resolution sunspot counts point to more complex sunspots? 48X8 CME 12X1.9 CME 1365
More topicsSupport SpaceWeatherLive.com!
A lot of people come to SpaceWeatherLive to follow the Solar activity or if there is a chance to see the aurora, but with more traffic comes higher costs to keep the servers online. If you like SpaceWeatherLive and want to support the project you can choose a subscription for an ad-free site or consider a donation. With your help we can keep SpaceWeatherLive online!


Space weather facts
| Last X-flare | 2026/02/03 | X1.5 |
| Last M-flare | 2026/02/03 | M2.5 |
| Last geomagnetic storm | 2026/01/28 | Kp5+ (G1) |
| Spotless days | |
|---|---|
| Last spotless day | 2022/06/08 |
| Monthly mean Sunspot Number | |
|---|---|
| December 2025 | 124 +32.2 |
| February 2026 | 114 -10 |
| Last 30 days | 118.1 +6.2 |