Top 50 geomagnetic storms
On this page you will find an overview of the strongest geomagnetic storms since January 1957 together with links to more information in our archive. Storms are ranked by the Disturbance storm-time index (Dst) that is designed to measure the magnetic signature of magnetospheric currents observed in the equatorial regions. The Dst index is provided by the World Data Center for geomagnetism in Kyoto. When available, the maximum solar wind speed and the conditions of the interplanetary magnetic field (IMF Bt and Bz) are shown. This page is updated daily.
Latest news
G3 geomagnetic storm watch for 4 and 5 June
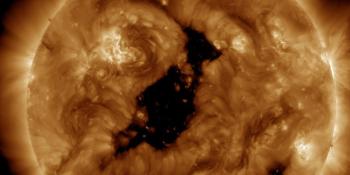
Coronal hole faces Earth
X1.5 solar flare
Latest forum messages
Support SpaceWeatherLive.com!
A lot of people come to SpaceWeatherLive to follow the Solar activity or if there is a chance to see the aurora, but with more traffic comes higher costs to keep the servers online. If you like SpaceWeatherLive and want to support the project you can choose a subscription for an ad-free site or consider a donation. With your help we can keep SpaceWeatherLive online!


Space weather facts
| Last X-flare | 2026/06/03 | X1.0 |
| Last M-flare | 2026/06/06 | M1.8 |
| Last geomagnetic storm | 2026/06/11 | Kp5 (G1) |
| Spotless days | |
|---|---|
| Last 365 days | 3 days |
| 2026 | 3 days (2%) |
| Last spotless day | 2026/02/24 |
| Monthly mean Sunspot Number | |
|---|---|
| May 2026 | 101.4 +22.1 |
| June 2026 | 114.1 +12.7 |
| Last 30 days | 110.4 +16.4 |