Solar activity report
Below you'll find a daily report brought to you by the NOAA about the solar activity and auroral activity during the past day and the prediction for the coming days. This page is daily updated around midnight.
Report of Solar-Geophysical Activity 2026 Jun 17 2200 UTCPrepared by the NOAA © SWPC and processed by SpaceWeatherLive.com
Joint USAF/NOAA Report of Solar and Geophysical Activity
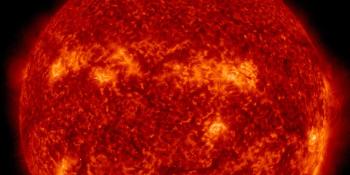
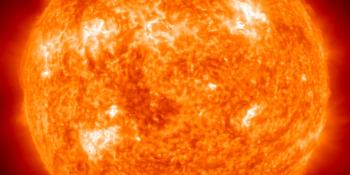
SDF Number 168 Issued at 2200Z on 17 Jun 2026IA. Analysis of Solar Active Regions and Activity from 16-2100Z to 17-2100Z Solar activity has been at low levels for the past 24 hours.
There are currently 3 numbered sunspot regions on the disk.
IB. Solar Activity Forecast
Solar activity is likely to be low with a
slight chance for an M-class flare on day one (18 Jun) and expected to
be low with a slight chance for an M-class flare on days two and three
(19 Jun, 20 Jun).
IIA. Geophysical Activity Summary 16-2100Z to 17-2100Z
The geomagnetic
field has been at quiet levels for the past 24 hours. Solar wind speed
reached a peak of 509 km/s at 17/1452Z. Total IMF reached 12 nT at
17/0535Z. The maximum southward component of Bz reached -6 nT at
17/0803Z. Electrons greater than 2 MeV at geosynchronous orbit reached
a peak level of 1012 pfu.
IIB. Geophysical Activity Forecast
The geomagnetic field is expected
to be at quiet to unsettled levels on day one (18 Jun) and quiet to
active levels on days two and three (19 Jun, 20 Jun).
III. Event Probabilities 18 Jun to 20 Jun
| Class M | 10% | 15% | 15% |
| Class X | 01% | 01% | 01% |
| Proton | 01% | 01% | 01% |
| PCAF | green | ||
IV. Penticton 10.7 cm Flux
  Observed       17 Jun 111
  Predicted   18 Jun-20 Jun 112/114/118
  90 Day Mean        17 Jun 126
V. Geomagnetic A Indices
  Observed Afr/Ap 16 Jun  006/006
  Estimated     Afr/Ap 17 Jun  005/006
  Predicted    Afr/Ap 18 Jun-20 Jun  008/010-015/015-011/012
VI. Geomagnetic Activity Probabilities 18 Jun to 20 Jun
| A. Middle Latitudes | |||
|---|---|---|---|
| Active | 20% | 35% | 30% |
| Minor storm | 05% | 20% | 15% |
| Major-severe storm | 01% | 05% | 01% |
| B. High Latitudes | |||
|---|---|---|---|
| Active | 15% | 10% | 15% |
| Minor storm | 25% | 30% | 25% |
| Major-severe storm | 30% | 50% | 40% |
Latest news
Thursday, 4 June 2026
G3 geomagnetic storm watch for 4 and 5 June
Wednesday, 13 May 2026
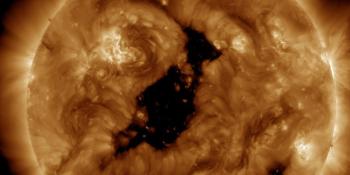
Coronal hole faces Earth
Monday, 30 March 2026
X1.5 solar flare
Latest forum messages
Can not log in with Facebook 6Current Farside Activity 641Incoming & Unnumbered Active Regions 475Ham Radio license plates and humor. 10Unspecified geomagnetic activity 313
More topicsSupport SpaceWeatherLive.com!
A lot of people come to SpaceWeatherLive to follow the Solar activity or if there is a chance to see the aurora, but with more traffic comes higher costs to keep the servers online. If you like SpaceWeatherLive and want to support the project you can choose a subscription for an ad-free site or consider a donation. With your help we can keep SpaceWeatherLive online!


Space weather facts
| Last X-flare | 2026/06/03 | X1.0 |
| Last M-flare | 2026/06/06 | M1.8 |
| Last geomagnetic storm | 2026/06/11 | Kp5 (G1) |
| Spotless days | |
|---|---|
| Last 365 days | 3 days |
| 2026 | 3 days (2%) |
| Last spotless day | 2026/02/24 |
| Monthly mean Sunspot Number | |
|---|---|
| May 2026 | 101.4 +22.1 |
| June 2026 | 108.1 +6.7 |
| Last 30 days | 109.2 +12.9 |
This day in history*
Aurora on this day in history
No observations submitted for this day in history. If you've observed the aurora and you have some amazing photos to show off, submit your observations now!
Submit your aurora observation