Activity summary of the solar and geophysical activity
Below you'll find a daily report brought to you by the NOAA about the solar activity and geophysical activity during the past day and the prediction for the coming days. This page is daily updated around midnight.
Solar and Geophysical Activity Summary 2026 Jun 18 0245 UTCPrepared by the NOAA © SWPC and processed by SpaceWeatherLive.com
Joint USAF/NOAA Solar and Geophysical Activity Summary
SGAS Number 169 Issued at 0245Z on 18 Jun 2026 This report is compiled from data received at SWO on 17 JunA. Energetic Events
Begin  Max  End  Rgn   Loc   Xray  Op 245MHz 10cm   Sweep
 1410 1411 1411                       400
 1414 1414 1415                       120
 1457 1506 1510  4464        C2.5     210
 1522 1522 1523                       290
B. Proton Events
None.
C. Geomagnetic Activity Summary
The geomagnetic field ws quiet.
D. Stratwarm
Not available
E. Daily Indices: (real-time preliminary/estimated values)
10 cm 111  SSN 050  Afr/Ap 007/006   X-ray Background B4.0
Daily Proton Fluence (flux accumulation over 24 hrs)
GT 1 MeV 5.0e+05   GT 10 MeV 1.7e+04 p/(cm2-ster-day)
(GOES-18 satellite synchronous orbit W137 degrees)
Daily Electron Fluence
GT 2 MeV 3.70e+07 e/(cm2-ster-day)
(GOES-19 satellite synchronous orbit W72 degrees)
3 Hour K-indices
Boulder 2 2 ? ? ? ? ? ? Planetary 2 1 2 2 2 1 0 1
F. Comments
  Missing Boulder K-indices: 12-15 = 3; 15-18 = 2; 18-21
= 1; 21-24 = 2. The magnetometer had a data outage during the 06-09
and 09-12 synoptic periods.
Latest news
Thursday, 4 June 2026
G3 geomagnetic storm watch for 4 and 5 June
Wednesday, 13 May 2026
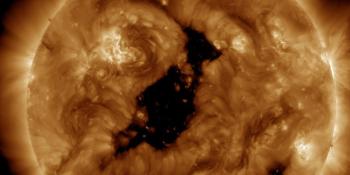
Coronal hole faces Earth
Monday, 30 March 2026
X1.5 solar flare
Latest forum messages
Incoming & Unnumbered Active Regions 477Current Farside Activity 647AR14471 4AR4472 1Unspecified geomagnetic activity 315
More topicsSupport SpaceWeatherLive.com!
A lot of people come to SpaceWeatherLive to follow the Solar activity or if there is a chance to see the aurora, but with more traffic comes higher costs to keep the servers online. If you like SpaceWeatherLive and want to support the project you can choose a subscription for an ad-free site or consider a donation. With your help we can keep SpaceWeatherLive online!


Space weather facts
| Last X-flare | 2026/06/03 | X1.0 |
| Last M-flare | 2026/06/06 | M1.8 |
| Last geomagnetic storm | 2026/06/11 | Kp5 (G1) |
| Spotless days | |
|---|---|
| Last 365 days | 3 days |
| 2026 | 3 days (2%) |
| Last spotless day | 2026/02/24 |
| Monthly mean Sunspot Number | |
|---|---|
| May 2026 | 101.4 +22.1 |
| June 2026 | 104.7 +3.3 |
| Last 30 days | 108.3 +10.8 |
This day in history*
Aurora on this day in history
No observations submitted for this day in history. If you've observed the aurora and you have some amazing photos to show off, submit your observations now!
Submit your aurora observation