Aurora forecast Help
Probability forecast
| Today | Active | Minor | Severe |
|---|---|---|---|
| High latitude | 5% | 5% | 20% |
| Middle latitude | 10% | 10% | 1% |
Kp-index forecast
| Min. | Max. | |
|---|---|---|
| Thursday | Kp2 | Kp4+ |
| Friday | Kp4 | Kp6 |
| Saturday | Kp2 | Kp5- |
Predicted Kp-indices
Below you'll find the expected global geomagnetic conditions (Kp) and those for the middle and high latitudes (K-indices). These values indicate the expected geomagnetic activity for any given 3-hour period for the next three days. This is the fastest way to quickly find out what kind of geomagnetic conditions are to be expected over the next 3 days. The predictions are updated daily by the NOAA SWPC and do not necessarily reflect the predictions made by the SpaceWeatherLive team. Times are in UTC.
All times in UTC
Long term Kp forecast
Below you'll find the daily maximum expected global geomagnetic conditions (Kp) for the coming 27 days. This is the fastest way to quickly find out what kind of geomagnetic conditions are to be expected over the next 27 days. These predictions are updated weekly by the NOAA SWPC. While space weather is hard to forecast so far in advance, this list can be useful to spot when recurrent and reliable solar features like coronal hole solar wind streams become geoeffective again.
All times in UTC
Latest news
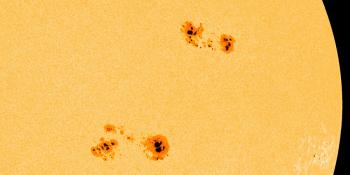
X1.1 solar flare, G2 watch
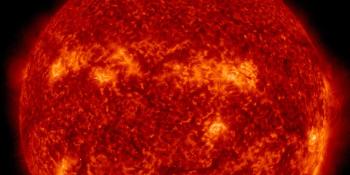
G3 geomagnetic storm watch for 4 and 5 June
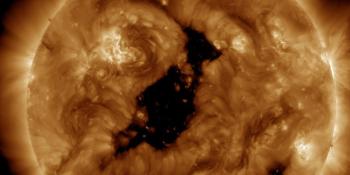
Coronal hole faces Earth
Latest forum messages
Support SpaceWeatherLive.com!
A lot of people come to SpaceWeatherLive to follow the Solar activity or if there is a chance to see the aurora, but with more traffic comes higher costs to keep the servers online. If you like SpaceWeatherLive and want to support the project you can choose a subscription for an ad-free site or consider a donation. With your help we can keep SpaceWeatherLive online!


Space weather facts
| Last X-flare | 2026/06/30 | X1.1 |
| Last M-flare | 2026/07/02 | M2.87 |
| Last geomagnetic storm | 2026/06/25 | Kp5 (G1) |
| Spotless days | |
|---|---|
| Last 365 days | 3 days |
| 2026 | 3 days (2%) |
| Last spotless day | 2026/02/24 |
| Monthly mean Sunspot Number | |
|---|---|
| May 2026 | 101.4 +22.1 |
| July 2026 | 146 +44.6 |
| Last 30 days | 103.5 +4.4 |