What is a solar radiation storm?
A solar radiation storm (also known as a Solar Proton Event or SPE) occurs often after major eruptions on the Sun when protons get launched at incredibly high speeds, sometimes up to several 10.000 km/s. These radiation storms can bridge the Sun-Earth distance in as little time as 30 minutes and last for multiple days. In this article we are going to explain what a solar radiation storm is and what kind of effects it has on us.
S-scale
NOAA uses a five-level system called the S-scale, to indicate the severity of a solar radiation storm. This scale ranges from S1 to S5, with S1 being the lowest level and S5 being the highest level. Every S-level has a pfu (proton flux unit) threshold associated with it. For example: S1 solar radiation storm levels are reached when the 10 MeV pfu count reaches a value of 10 at geosynchronous satellite altitudes. Do note that this scale is actually logarithmic. What that means it that a moderate (S2) proton event occurs when the proton flux reaches 100 pfu, not 20! For a strong (S3) solar radiation storm, a pfu of 1000 is required. We often use this S-scale on the website so it’s wise to familiarize yourself with it. We can define the following solar radiation storm classes:
| S-scale | Description | Flux threshold | Average frequency | Reliability ACE solar wind data |
|---|---|---|---|---|
| S1 | Minor | 101 | 50 per cycle | Data reliable |
| S2 | Moderate | 102 | 25 per cycle | Data might be unreliable |
| S3 | Strong | 103 | 10 per cycle | Data likely unreliable |
| S4 | Severe | 104 | 3 per cycle | Data likely unreliable |
| S5 | Extreme | 105 | Fewer than 1 per cycle | Data likely unreliable |
Dangers
Solar radiation storms are not dangerous for people on Earth. We are protected from these storms by Earth’s magnetic field and Earth’s atmosphere. One effect that we can experience on Earth during strong solar radiation storms is an increased risk of people on transpolar flights receiving a higher dose of radiation than normal. Transpolar flights sometimes have to be rerouted or canceled because of these radiation storms. Another effect is that it can cause some communication problems over the polar areas. These protons are also a radiation threat to astronauts, in particular during their extra-vehicular activities (space walks). Satellites out in space are also vulnerable: these protons degrade solar panel efficiency, on board electronic circuitry can malfunction and the protons will create noise in star-tracking systems.
At arctic latitudes, High Frequency (HF) radio communication can become problematic or even impossible. The fast moving protons penetrate the magnetosphere and are guided down the magnetic field lines, penetrating the atmosphere near the north and south poles. These protons ionize the D-layer and this process prevents the HF radio waves from reaching the much higher E, F1 and F2 layers where these radio signals normally refract and bounce back to Earth. Such radio blackouts are known as Polar Cap Absorption (PCA) events and can last for days. The result is little to no HF radio communication being possible over trans polar routes. We can use the S-scale to estimate the severity of a Polar Cap Absorption (PCA) event.
| S-scale | Description | Impacts |
|---|---|---|
| S1 | Minor | Minor impacts on HF through polar regions. |
| S2 | Moderate | Infrequent effects on HF through polar regions and satellite operations. |
| S3 | Strong | Degraded HF at polar regions and navigation position errors, satellite effects on imaging systems and solar panel currents, significant radiation hazard to astronauts on extra-vehicular activity (EVA) and high-latitude aircraft passengers. |
| S4 | Severe | Blackout of HF through the polar regions and navigation position errors over several days, satellite effects degraded imaging systems and memory device problems, high radiation risk to astronauts on extra-vehicular activity (EVA) and high-latitude aircraft passengers. |
| S5 | Extreme | No HF in the polar regions and position errors make navigation operations extremely difficult, loss of some satellites and memory impacts cause loss of control, unavoidable high radiation risk for astronauts on EVA and high-latitude aircraft passengers. |
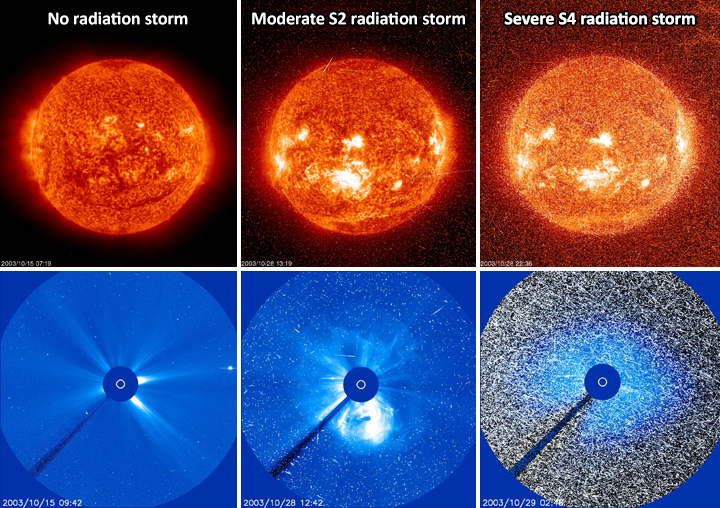
The image below shows you a good example what happens to satellites during solar radiations storms. From left to right we see some imagery from two different SOHO instruments. On the left you see how the imagery normally looks when there is no solar radiation storm. On the right you can see what happens during a severe S4 solar radiation storm. There are so many protons crashing into the camera’s sensor that it causes a lot of noise on the images. The images are almost unusable.

Problems with the Advanced Composition Explorer (ACE) during solar radiation storms
It is possible that during a solar radiation storm, some data coming from the Advanced Composition Explorer (ACE) satellite become contaminated and register false values. This can be seen with the solar wind parameters which comes from the SWEPAM instrument. The solar wind speed becomes lower then it really is and the density becomes less then 1 proton per square centimeter. The data that is related to the interplanetary magnetic field (IMF) remains reliable during a solar radiation storm. These false readings can occur when a solar radiation storm reaches the S2 level (moderate solar radiation storm) and can often continue till well after the arrival of a coronal mass ejection which makes detecting the arrival of a coronal mass ejection a lot harder. The DSCOVR space craft which replaced ACE in 2016 does not have these issues.
Latest news
Latest forum messages
Support SpaceWeatherLive.com!
A lot of people come to SpaceWeatherLive to follow the Solar activity or if there is a chance to see the aurora, but with more traffic comes higher costs to keep the servers online. If you like SpaceWeatherLive and want to support the project you can choose a subscription for an ad-free site or consider a donation. With your help we can keep SpaceWeatherLive online!
Space weather facts
| Last X-flare | 2026/02/03 | X1.5 |
| Last M-flare | 2026/02/03 | M2.5 |
| Last geomagnetic storm | 2026/01/28 | Kp5+ (G1) |
| Spotless days | |
|---|---|
| Last spotless day | 2022/06/08 |
| Monthly mean Sunspot Number | |
|---|---|
| December 2025 | 124 +32.2 |
| February 2026 | 114 -10 |
| Last 30 days | 118.1 +6.2 |


