Strong G3 geomagnetic storm
Sunday, 26 August 2018 10:03 UTC
We were wrong! The coronal mass ejection we talked about back on 22 August did arrive at Earth and sparked strong G3 geomagnetic storming conditions today. A big surprise for everyone which goes to show how unpredictable space weather is.
The plasma cloud was slow which is something that actually was to be expected and the solar wind speed had a constant speed of around 400 to 450km/s during the past 36 hours or so. There was no classic shock impact which we often see with faster coronal mass ejections so what gave away that this indeed was a coronal mass ejection?
These unexpectedly strong geomagnetic storm conditions are caused by an enhanced magnetic field with a persistent southward orientation (Bz) which is a common occurrence when the core of a coronal mass ejection (magnetic cloud) passes our planet. Indeed, this was not just a glancing blow! Negative (southward) Bz values have been observed since around 15 UTC yesterday and these values gradually increased to a minimum of -17nT. Not bad for a wimpy coronal mass ejection! The persistent southward orientation of the IMF constantly fueled the auroral displays above our planet resulting in unexpectedly strong geomagnetic storm conditions.
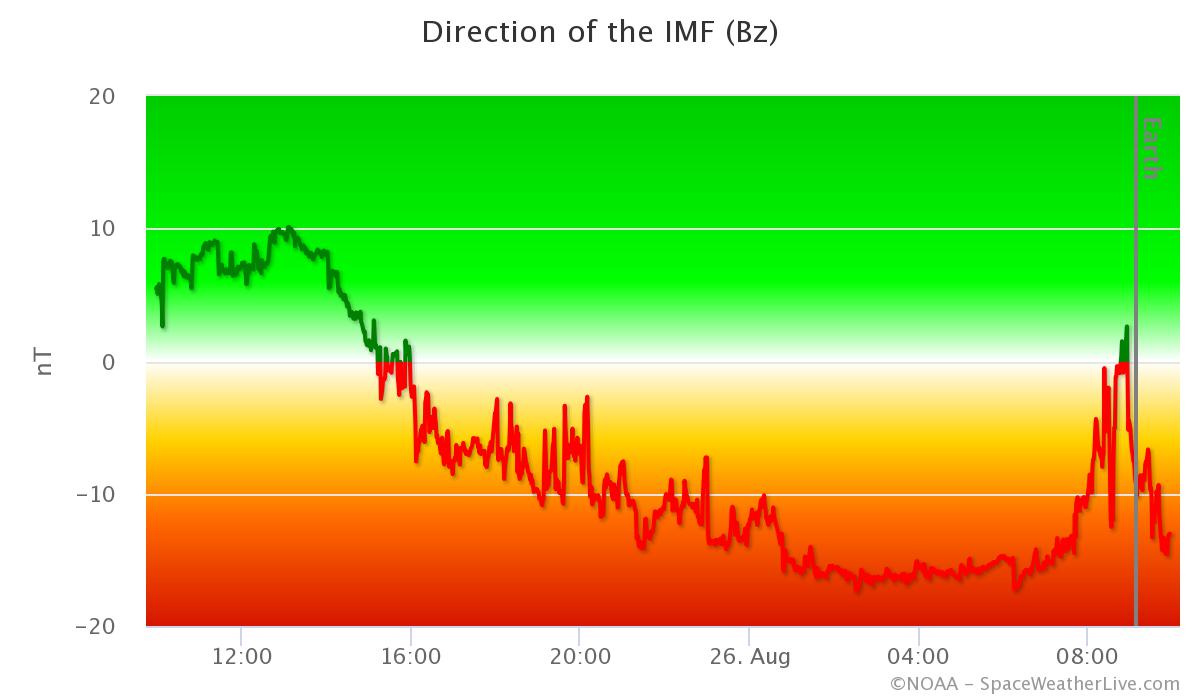
Geomagnetic storming gradually increased in strength until 05:59 UTC today when the NOAA SWPC reported that the strong G3 geomagnetic storm threshold was reached. Even the Disturbance Storm Time index dropped deep to a lowest value of -186nT.
Strong G3 geomagnetic storm (Kp7)
— SpaceWeatherLive (@_SpaceWeather_) August 26, 2018
Threshold Reached: 05:59 UTC
Follow live on https://t.co/Zkq26B89Y7 pic.twitter.com/8JeudpHZ7z
At the time of writing, the solar wind speed has now increased slightly to 450km/s and the Bz once again drops well below the -10nT so geomagnetic storm conditions are likely to persist in the hours ahead which should be great news for sky watchers in the northern USA, southern New Zealand, and Tasmania/Melbourne area.
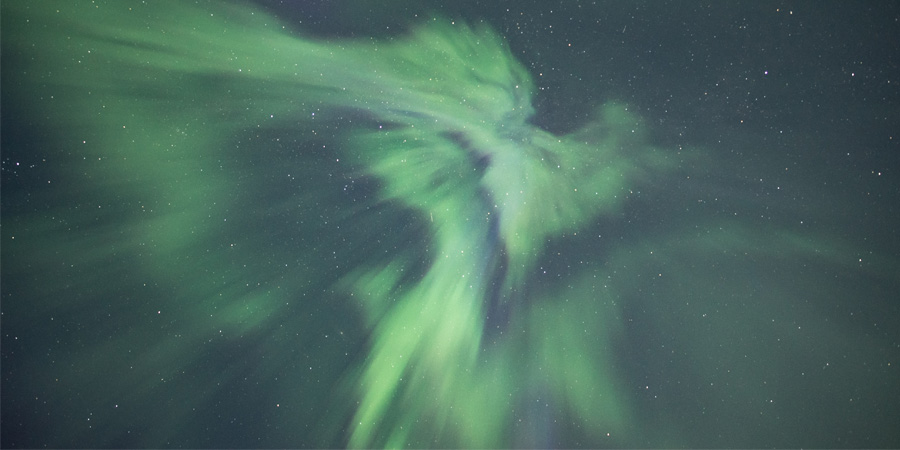
Header image: Aurora above Kiruna, Sweden by Marcel de Bont.
Thank you for reading this article! Did you have any trouble with the technical terms used in this article? Our help section is the place to be where you can find in-depth articles, a FAQ and a list with common abbreviations. Still puzzled? Just post on our forum where we will help you the best we can!
Latest news
X1.5 solar flare
M2.7 solar flare, CME arrival possible
Complex sunspot region 4366
Latest forum messages
Support SpaceWeatherLive.com!
A lot of people come to SpaceWeatherLive to follow the Solar activity or if there is a chance to see the aurora, but with more traffic comes higher costs to keep the servers online. If you like SpaceWeatherLive and want to support the project you can choose a subscription for an ad-free site or consider a donation. With your help we can keep SpaceWeatherLive online!


Space weather facts
| Last X-flare | 2026/03/30 | X1.4 |
| Last M-flare | 2026/03/28 | M1.3 |
| Last geomagnetic storm | 2026/03/25 | Kp5+ (G1) |
| Spotless days | |
|---|---|
| Last 365 days | 3 days |
| 2026 | 3 days (3%) |
| Last spotless day | 2026/02/24 |
| Monthly mean Sunspot Number | |
|---|---|
| February 2026 | 78.2 -34.3 |
| March 2026 | 88.4 +10.2 |
| Last 30 days | 88.4 +14.9 |