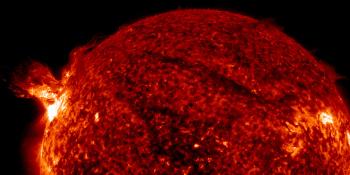
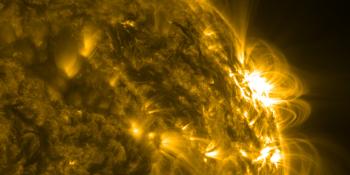
Solcykelns utveckling
Diagrammen på den här sidan visar hur solcykelns utveckling fortskrider. Graferna uppdateras månadsvis av prognoscentret för rymdväder, SWPC.
Antal C, M och X-klass utbrott per år
Grafen visar antalet C, M och X-klassutbrott vilka inträffat under det angivna året. Det ger oss en uppskattning och överblick över antalet utbrott i relation till solfläcksnumret. Det är alltså ett sätt att mäta hur en solcykel utvecklas över tid. Informationen kommer från NOAA SPWC och uppdateras dagligen.
Grafen visar antalet C, M och X-klassutbrott, i samband med solfläcksnumret (link to explanation of sunspot number). Informationen visar senaste månadens aktivitet och kommer från NOAA SWPC. Uppdateras dagligen.
The Butterfly Diagram
Throughout the solar cycle, the latitude of sunspot regions varies with an interesting pattern. The graph below shows the latitude of all sunspot regions of the last 22 years versus the time (in years). Sunspots are typically confined between -35° south and +35 degrees north latitude. At the beginning of a new solar cycle, sunspot regions are formed at a higher latitudes, but as the cycle progresses towards the maximum, the sunspot regions gradually form at lower latitudes. When nearing the solar minimum, the sunspot regions appear around the solar equator and as a new cycle starts again, sunspots of the new cycle will start to emerge at a high latitude. This recurrent behaviour of sunspots give rise to the 'Butterfly' pattern and was first discovered by Edward Maunder in 1904. The graph is updated every month.
Antal dagar per år utan solfläckar
Under perioder av låg solaktivitet kan solen helt sakna solfläckar/solfäcksregioner. Det här är en återkommande episod under åren kring solminimum. Diagrammet nedan visar hur antalet dagar ett specifikt år var utan jordriktade solfäcksregioner.
Antal dagar med geomagnetiska stormar per år
Grafen visar dagar med geomagnetiska stormar per år men också hur starka dessa varit. Det ger oss en uppskattning och överblick över särskilt aktiva år och perioder.
Senaste nytt
Senaste inläggen
Stöd SpaceWeatherLive.com!
A lot of people come to SpaceWeatherLive to follow the Solar activity or if there is a chance to see the aurora, but with more traffic comes higher costs to keep the servers online. If you like SpaceWeatherLive and want to support the project you can choose a subscription for an ad-free site or consider a donation. With your help we can keep SpaceWeatherLive online!
Rymdvädersfakta
| Senaste X-utbrottet | 2025/12/08 | X1.1 |
| Senaste M-utbrottet | 2025/12/21 | M1.3 |
| Senaste geomagnetiska stormen | 2025/12/12 | Kp5 (G1) |
| Fläckfria dagar | |
|---|---|
| Senaste dag utan solfläckar | 2022/06/08 |
| Månadsvis faktiskt antal solfläckar | |
|---|---|
| november 2025 | 91.8 -22.8 |
| december 2025 | 118.5 +26.7 |
| Last 30 days | 109.9 +23 |


