Norrskensaktivitet i realtid
Below you will find the latest solar wind and interplanetary magnetic field data covering the past 24 hours as measured by the Deep Space Climate Observatory (DSCOVR) spacecraft located at the Sun-Earth L1 point. These parameters are the first parameters used to predict auroral activity. The redder the plots get, the better it is for auroral activity! With the current speed, it will take the solar wind 60 minutes to propagate from DSCOVR to Earth.
Hastighet: km/s
Densitet: p/cm3
Bt: nT
Bz:
Senaste nytt
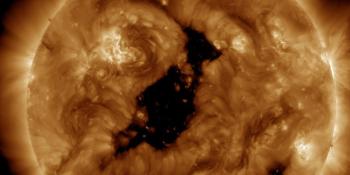
Coronal hole faces Earth
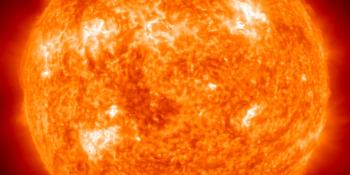
X1.5 solar flare
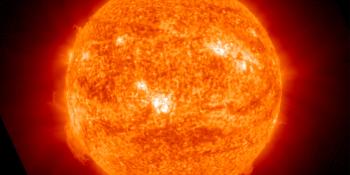
M2.7 solar flare, CME arrival possible
Senaste inläggen
Fler foruminläggStöd SpaceWeatherLive.com!
A lot of people come to SpaceWeatherLive to follow the Solar activity or if there is a chance to see the aurora, but with more traffic comes higher costs to keep the servers online. If you like SpaceWeatherLive and want to support the project you can choose a subscription for an ad-free site or consider a donation. With your help we can keep SpaceWeatherLive online!


Rymdvädersfakta
| Senaste X-utbrottet | 2026/04/24 | X2.5 |
| Senaste M-utbrottet | 2026/05/22 | M2.3 |
| Senaste geomagnetiska stormen | 2026/05/16 | Kp6- (G2) |
| Fläckfria dagar | |
|---|---|
| Last 365 days | 3 dagar |
| 2026 | 3 dagar (2%) |
| Senaste dag utan solfläckar | 2026/02/24 |
| Månadsvis faktiskt antal solfläckar | |
|---|---|
| april 2026 | 79.3 -6.6 |
| maj 2026 | 87.5 +8.2 |
| Last 30 days | 98 +7.5 |