Solcykel-historik
Diagrammet på den här sidan visar antalet solfläckar sedan 1749. Det var då den första insamlingen av den här typen av data började. Du kan zooma in i diagrammet genom att välja en specifik tidsperiod. Du kan välja att visa viss information eller dölja den genom att trycka på de olika undergrupperna. Du kan även exportera diagrammet som en JPG, SVG, PDF eller PNG-fil.
Comparing solar cycles
The chart below lets you compare several solar cycles with each other to see how the several solar cycles differ with each other and see how the current solar cycle progresses in relation to other solar cycles. The chart is shown with the current and last solar cycle, you can show/hide any solar cycle by clicking/tapping in the legend below the chart.
Senaste nytt
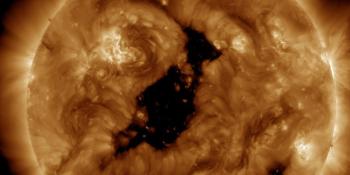
Coronal hole faces Earth
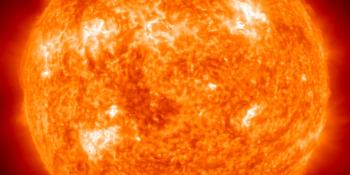
X1.5 solar flare
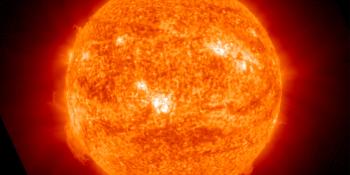
M2.7 solar flare, CME arrival possible
Senaste inläggen
Fler foruminläggStöd SpaceWeatherLive.com!
A lot of people come to SpaceWeatherLive to follow the Solar activity or if there is a chance to see the aurora, but with more traffic comes higher costs to keep the servers online. If you like SpaceWeatherLive and want to support the project you can choose a subscription for an ad-free site or consider a donation. With your help we can keep SpaceWeatherLive online!


Rymdvädersfakta
| Senaste X-utbrottet | 2026/04/24 | X2.5 |
| Senaste M-utbrottet | 2026/05/22 | M2.3 |
| Senaste geomagnetiska stormen | 2026/05/16 | Kp6- (G2) |
| Fläckfria dagar | |
|---|---|
| Last 365 days | 3 dagar |
| 2026 | 3 dagar (2%) |
| Senaste dag utan solfläckar | 2026/02/24 |
| Månadsvis faktiskt antal solfläckar | |
|---|---|
| april 2026 | 79.3 -6.6 |
| maj 2026 | 87.5 +8.2 |
| Last 30 days | 98 +7.5 |