Índex Kp
Previsió de l'índex Kp
| Mín. | Màx. | |
|---|---|---|
| dimecres | Kp2 | Kp5 |
| dijous | Kp2 | Kp5- |
| divendres | Kp3 | Kp4- |
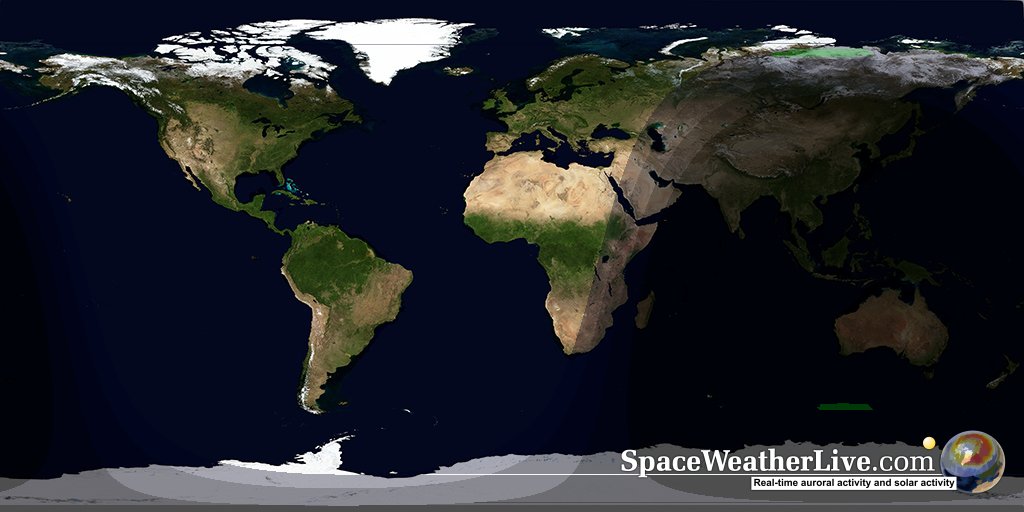
Vent solar en temps real
Amb la velocitat actual, el vent solar trigarà 60 minuts a propagar-se de ACE a la Terra.
Vent solar
Velocitat:
km / seg
Densitat: p/cm3
Camp magnètic interplanetari
Bt:
nT
Bz: nT
Informació
Més dades

Últimes notícies
dilluns, 30 de març 2026
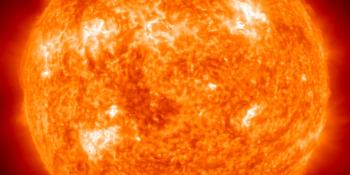
X1.5 solar flare
dimarts, 17 de març 2026
M2.7 solar flare, CME arrival possible
diumenge, 1 de febrer 2026
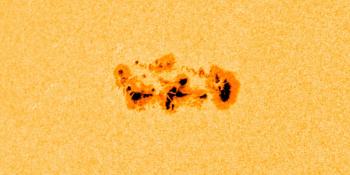
Complex sunspot region 4366
Últims missatges del fòrum
AR4409 4AR4405 151X1.5 CME (2026-03-30) 318Comet C/2026 A1 (MAPS) for the southern hemisphere 29Filaments and prominences 538
Més temesDona suport a SpaceWeatherLive.com!
A lot of people come to SpaceWeatherLive to follow the Solar activity or if there is a chance to see the aurora, but with more traffic comes higher costs to keep the servers online. If you like SpaceWeatherLive and want to support the project you can choose a subscription for an ad-free site or consider a donation. With your help we can keep SpaceWeatherLive online!


Fets del temps al espai
| Última Flamarada-X | 2026/03/30 | X1.5 |
| Última Flamarada-M | 2026/03/28 | M1.3 |
| Última tempesta geomagnètica | 2026/03/25 | Kp5+ (G1) |
| Dies sense taques | |
|---|---|
| Last 365 days | 3 dies |
| 2026 | 3 dies (3%) |
| Últim dia sense taques | 2026/02/24 |
| Número mensual mitjà de taques solars | |
|---|---|
| de febrer 2026 | 78.2 -34.3 |
| Last 30 days | 90 +16.9 |
Aquest dia a la història*
Aurora on this day in history
No observations submitted for this day in history. If you've observed the aurora and you have some amazing photos to show off, submit your observations now!
Submit your aurora observation