Activitat auroral en temps real
A continuació trobareu les últimes dades de vent solar i camp magnètic interplanetari que cobreixen les darreres 24 hores, mesurades per la sonda Advanced Explorer (ACE) situada al punt L1 Sol-Terra. Aquests paràmetres són els primers paràmetres que s’utilitzen per predir l’activitat auroral. Com més vermells siguin les gràfiques, millor per a l’activitat auroral!. Amb la velocitat actual, el vent solar trigarà 60 minuts a propagar-se de ACE a la Terra.
Velocitat: km / seg
Densitat: p/cm3
Bt: nT
Bz:
Últimes notícies
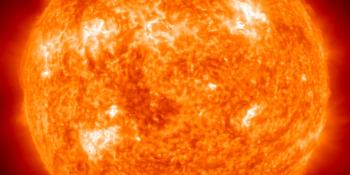
X1.5 solar flare
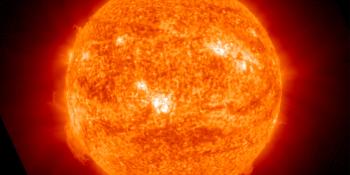
M2.7 solar flare, CME arrival possible
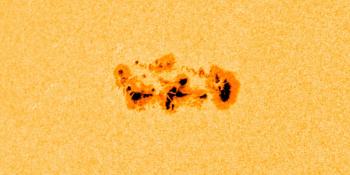
Complex sunspot region 4366
Últims missatges del fòrum
Dona suport a SpaceWeatherLive.com!
A lot of people come to SpaceWeatherLive to follow the Solar activity or if there is a chance to see the aurora, but with more traffic comes higher costs to keep the servers online. If you like SpaceWeatherLive and want to support the project you can choose a subscription for an ad-free site or consider a donation. With your help we can keep SpaceWeatherLive online!


Fets del temps al espai
| Última Flamarada-X | 2026/03/30 | X1.5 |
| Última Flamarada-M | 2026/03/28 | M1.3 |
| Última tempesta geomagnètica | 2026/03/25 | Kp5+ (G1) |
| Dies sense taques | |
|---|---|
| Last 365 days | 3 dies |
| 2026 | 3 dies (3%) |
| Últim dia sense taques | 2026/02/24 |
| Número mensual mitjà de taques solars | |
|---|---|
| de febrer 2026 | 78.2 -34.3 |
| Last 30 days | 90 +16.9 |