Cicles solars històrics
El gràfic d’aquesta pàgina mostra els números de taques solars des de 1749. Va ser llavors quan es va iniciar l’enregistrament extens de l’activitat de taques solars solars. Podeu ampliar aquesta gràfica seleccionant un període de temps que vulgueu veure. Es poden activar o desactivar tots els conjunts de dades fent clic a la descripció corresponent a sota de cada gràfic i es poden exportar com a fitxer JPG, PNG, PDF o SVG.
Comparing solar cycles
The chart below lets you compare several solar cycles with each other to see how the several solar cycles differ with each other and see how the current solar cycle progresses in relation to other solar cycles. The chart is shown with the current and last solar cycle, you can show/hide any solar cycle by clicking/tapping in the legend below the chart.
Últimes notícies
X1.5 solar flare
M2.7 solar flare, CME arrival possible
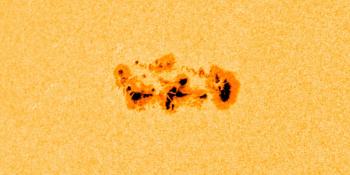
Complex sunspot region 4366
Últims missatges del fòrum
Dona suport a SpaceWeatherLive.com!
A lot of people come to SpaceWeatherLive to follow the Solar activity or if there is a chance to see the aurora, but with more traffic comes higher costs to keep the servers online. If you like SpaceWeatherLive and want to support the project you can choose a subscription for an ad-free site or consider a donation. With your help we can keep SpaceWeatherLive online!


Fets del temps al espai
| Última Flamarada-X | 2026/03/30 | X1.4 |
| Última Flamarada-M | 2026/03/28 | M1.3 |
| Última tempesta geomagnètica | 2026/03/25 | Kp5+ (G1) |
| Dies sense taques | |
|---|---|
| Last 365 days | 3 dies |
| 2026 | 3 dies (3%) |
| Últim dia sense taques | 2026/02/24 |
| Número mensual mitjà de taques solars | |
|---|---|
| de febrer 2026 | 78.2 -34.3 |
| Last 30 days | 90 +16.9 |