Progressió del cicle solar
Aquests gràfics d’aquesta pàgina s’assemblen al progrés del cicle solar. Els gràfics s'actualitzen cada mes pel SWPC amb les últimes prediccions de ISES. Els valors observats són inicialment valors temporals que se substitueixen per les dades finals un cop estan disponibles. Tots els gràfics d'aquesta pàgina es poden exportar com a fitxers JPG, PNG, PDF o SVG. Podeu activar o desactivar tots els conjunts de dades fent clic a la descripció corresponent de sota de cada gràfic.
Nombre de llums solars de classe C, M i X per any
El següent gràfic ens mostra el nombre de flamarades solars de classe C, M i X que es produeixen durant un any determinat. Ens dóna una bona idea de la quantitat de flamarades solars en relació amb el nombre de taques solars. Per tant, és una altra manera de veure com ha evolucionat un cicle solar amb el pas del temps. Aquestes dades provenen del SWPC de NOAA i s’actualitzen diàriament.
El següent gràfic mostra el nombre de flamarades solars de classe C, M i X que s'han produït durant el darrer mes juntament amb el nombre de taques solars de cada dia. Això us dóna una idea de l’activitat solar durant el darrer mes. Aquestes dades provenen del SWPC de NOAA i s’actualitzen diàriament.
The Butterfly Diagram
Throughout the solar cycle, the latitude of sunspot regions varies with an interesting pattern. The graph below shows the latitude of all sunspot regions of the last 22 years versus the time (in years). Sunspots are typically confined between -35° south and +35 degrees north latitude. At the beginning of a new solar cycle, sunspot regions are formed at a higher latitudes, but as the cycle progresses towards the maximum, the sunspot regions gradually form at lower latitudes. When nearing the solar minimum, the sunspot regions appear around the solar equator and as a new cycle starts again, sunspots of the new cycle will start to emerge at a high latitude. This recurrent behaviour of sunspots give rise to the 'Butterfly' pattern and was first discovered by Edward Maunder in 1904. The graph is updated every month.
Número de dies sense taques per any
Durant els períodes de baixa activitat solar, el Sol pot estar desproveït de taques solars i, per tant, estar sense taques. Això és freqüent durant els anys al voltant i durant el mínim solar. El següent gràfic mostra quants dies durant un any concret en que la cara del Sol, orientada a la Terra, no tenia taques solars.
Número de dies amb tempesta geomagnètica per any
El següent gràfic mostra el nombre de dies amb una tempesta geomagnètica per any i com d'intenses van ser. Això us donarà una idea en quins anys hi va haver moltes tempestes geomagnètiques.
Últimes notícies
X1.5 solar flare
M2.7 solar flare, CME arrival possible
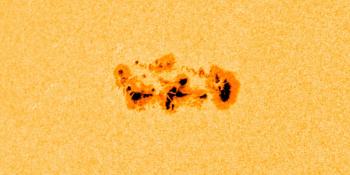
Complex sunspot region 4366
Últims missatges del fòrum
Més temesDona suport a SpaceWeatherLive.com!
A lot of people come to SpaceWeatherLive to follow the Solar activity or if there is a chance to see the aurora, but with more traffic comes higher costs to keep the servers online. If you like SpaceWeatherLive and want to support the project you can choose a subscription for an ad-free site or consider a donation. With your help we can keep SpaceWeatherLive online!


Fets del temps al espai
| Última Flamarada-X | 2026/03/30 | X1.5 |
| Última Flamarada-M | 2026/03/28 | M1.3 |
| Última tempesta geomagnètica | 2026/03/25 | Kp5+ (G1) |
| Dies sense taques | |
|---|---|
| Last 365 days | 3 dies |
| 2026 | 3 dies (3%) |
| Últim dia sense taques | 2026/02/24 |
| Número mensual mitjà de taques solars | |
|---|---|
| de febrer 2026 | 78.2 -34.3 |
| Last 30 days | 90 +16.9 |