Ciclos solares históricos
El gráfico de esta página muestra los números de manchas solares desde 1749. Fue entonces cuando comenzó la extensa grabación de la actividad de las manchas solares. Puede ampliar este gráfico seleccionando el período de tiempo que desea ver. Cada conjunto de datos se puede activar o desactivar haciendo clic en la descripción correspondiente debajo de cada gráfico y se puede exportar como un archivo JPG, PNG, PDF o SVG.
Comparing solar cycles
The chart below lets you compare several solar cycles with each other to see how the several solar cycles differ with each other and see how the current solar cycle progresses in relation to other solar cycles. The chart is shown with the current and last solar cycle, you can show/hide any solar cycle by clicking/tapping in the legend below the chart.
Últimas noticias
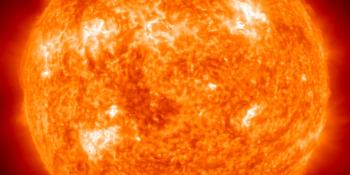
G3 geomagnetic storm watch for 4 and 5 June
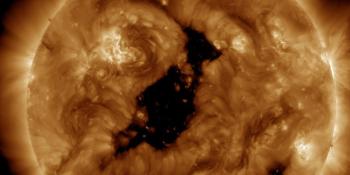
Coronal hole faces Earth
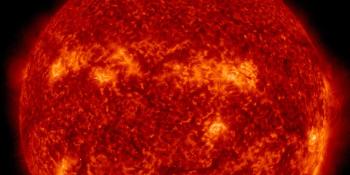
X1.5 solar flare
Últimos mensajes del foro
Apoye a SpaceWeatherLive.com!
A lot of people come to SpaceWeatherLive to follow the Solar activity or if there is a chance to see the aurora, but with more traffic comes higher costs to keep the servers online. If you like SpaceWeatherLive and want to support the project you can choose a subscription for an ad-free site or consider a donation. With your help we can keep SpaceWeatherLive online!


Hechos clima espacial
| Último evento clase X | 03/06/2026 | X1.0 |
| Último evento clase M | 21/06/2026 | M6.9 |
| Últimas tormentas geomagnéticas | 11/06/2026 | Kp5 (G1) |
| Días sin manchas | |
|---|---|
| Last 365 days | 3 días |
| 2026 | 3 días (2%) |
| Último día sin manchas | 24/02/2026 |
| Promedio de manchas solares mensuales | |
|---|---|
| mayo 2026 | 101.4 +22.1 |
| junio 2026 | 98.3 -3.1 |
| Last 30 days | 108.1 +9.3 |